2.1 KiB
meta-monitoring-chart
This is a meta-monitoring chart for GEL, GEM and GET. It should be installed in a separate namespace next to GEM, GEL or GET installations.
Preparation
Create a values.yaml file based on the default one.
-
Add or remove the namespaces to monitor in the
namespacesToMonitorsetting -
Set the cluster name in the
clusterNamesetting. This will be added as a label to all logs, metrics and traces. -
Create a
metanamespace.
Local and cloud modes
The chart has 2 modes: local and cloud. In the local mode logs, metrics and traces are sent to small Loki, Mimir and Tempo installations running in the meta-monitoring namespace.
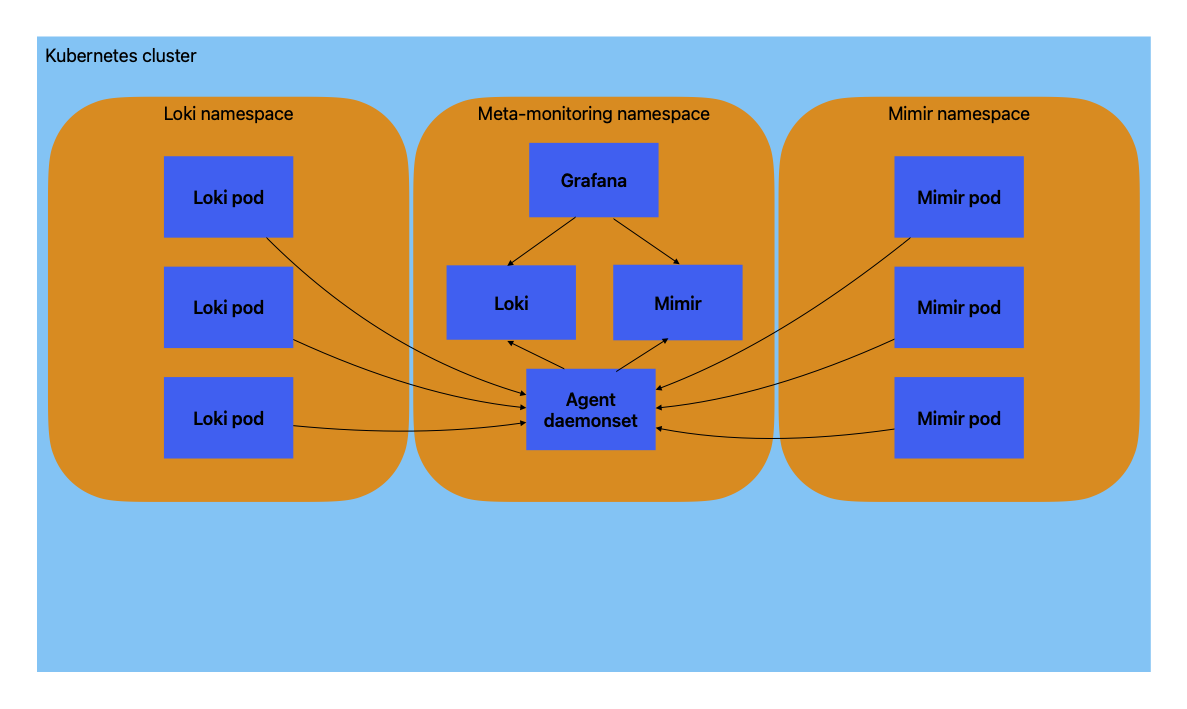
To enable local mode set local.enabled to true.
In the cloud mode the logs, metrics and traces are sent to
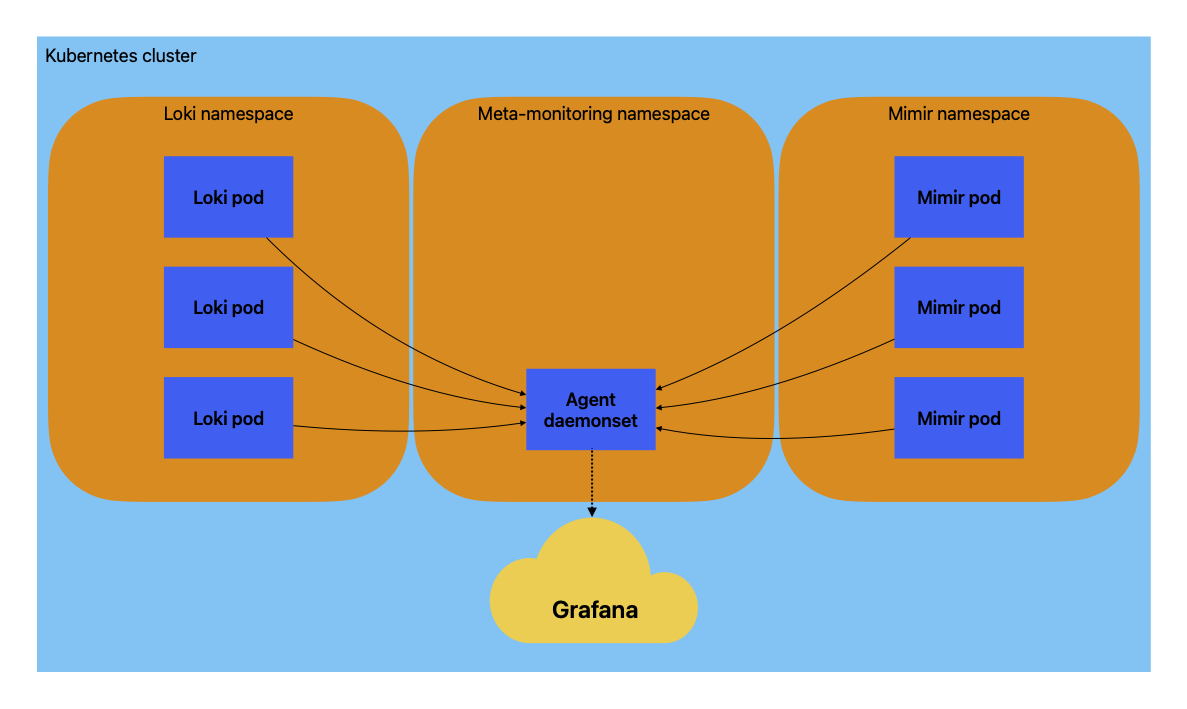
To enable cloud mode set cloud.enabled to true. The endpoint, username and password settings for your Grafana Cloud logs, metrics and traces instances have to be filled in as well.
Both modes can be enabled at the same time.
Installation
helm install -n meta --skip-crds -f values.yaml meta ./charts/meta-monitoring
If the platform supports CRDs the --skip-crds option can be removed. However the CRDs are not used by this chart.
For more instructions including how to update the chart go to the installation page.
Supported features
- Specify which namespaces are monitored
- Specify if logs, metrics or traces should be enabled for cloud or local
- Specify the cluster name used for the logs, metrics and traces
- Specify PII regexes that are applied to logs before they are sent to Loki (cloud or local). The capture group in the regex is replaced with *****.
- a Grafana instance is installed (when local mode is used) with the relevant datasources and dashboards installed.
- TBD: add dashboard for metrics and traces
- TBD: update the logs dashboards to be the SSD ones